
Use this page to view your logged data or local CSV files as a graph.
You can visualize the data as trend graphs either by loading data directly from memory or by uploading existing files from your PC.
The page can be opened from the floating menu in the bottom right corner of the screen or from the Data Logger page with Open 'Graphs' page under List and download log files.
Select the file storage location: Each option allows you to select multiple files.
List files: This command can be used for logged data. All files available on the device will be displayed.
Show files in separate graphs: If multiple files are selected, each file is displayed in a separate graph. If this option is deselected, all files are combined into one graph. Note that if this option is changed, the data source must be updated.
Show time without date: If enabled, the date is truncated and not displayed. This option is useful, for example, when comparing two files with different dates. Note that if this option is changed, the data source must be updated.
Start y-axis at zero: If enabled, the Y-axis of the graph will always start at 0. This option is always applied to all data in a graph.
Select graph type: The graph is automatically updated without reloading the data source after changing the type.
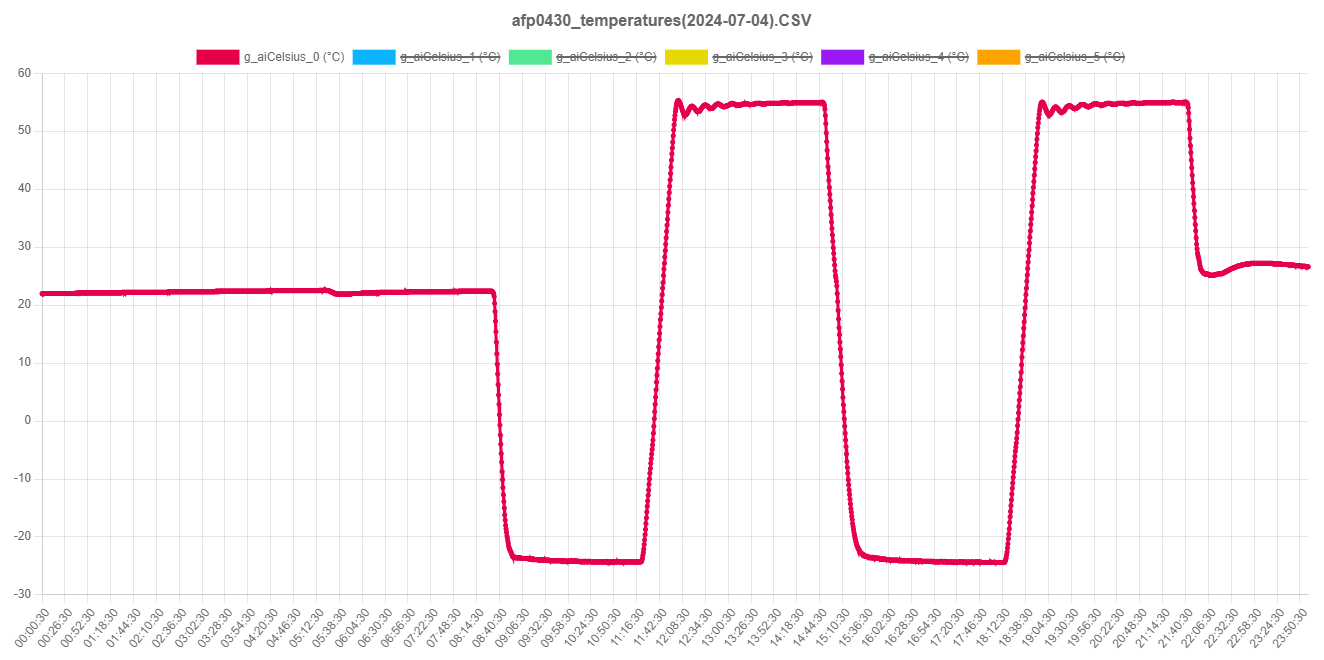
After uploading one or more files, the graph of each data point is displayed. The header contains the file name(s) and the data point names. Each data point is assigned a display color. If the unit of measurement is available in the log file, it is displayed in parentheses. You can toggle each graph on and off by clicking on the data point name or color.
To zoom in on a specific area of the graph, hold down CTRL on your keyboard and use your left mouse to drag the area you want to zoom in on. Select Reset zoom to reset all zooms.
Hide/show all data: To view individual graphs, hide all graphs with this button and then click the desired graphs in the header.
Update data: The selected log file(s) will be updated. This option is enabled only for graphs displayed from log files available on the FP-I4C unit. This feature is especially useful when visualizing the current file, which is still being logged and updated.