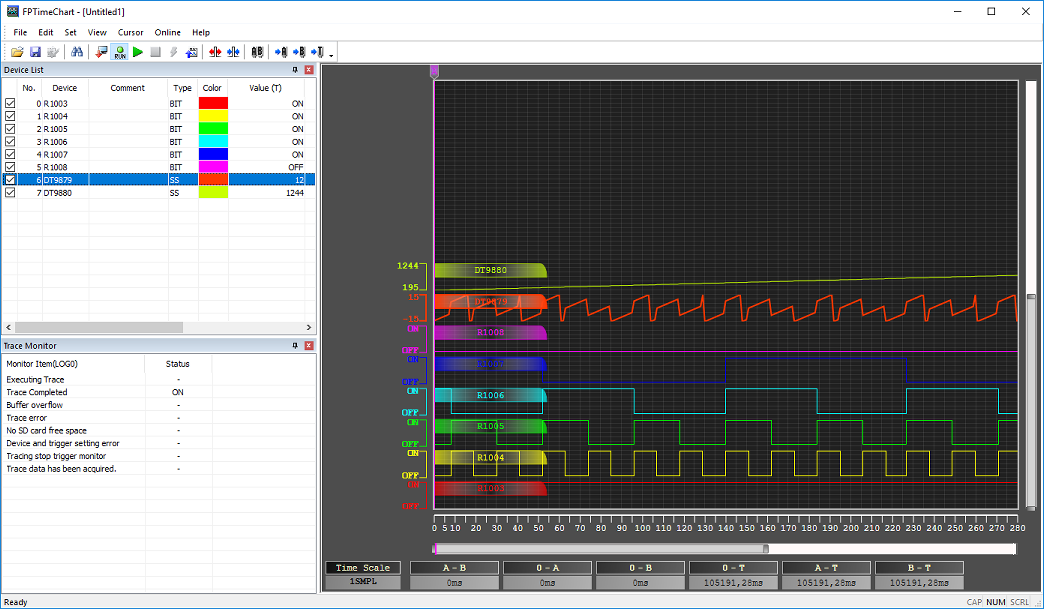
Trace monitor (Time line chart)
Time chart display
Time chart is a function to read the data stored in the PLC using the trace function and display them in graph form.
Before you can display the Trace time line chart, ensure a PLC project with a Trace data configuration is downloaded into the PLC.
Activate only one configuration to display the Trace time line chart
When the trace function has been selected, the change in inputs/outputs or data registers can be checked by one scan.
The following conditions are required to display a time chart.
Only one Trace number is selected.
The target LOG is set to Trace.
The data recording done flag of the target e.g. LOG0 is TRUE. When the stop trigger is detected, the sys_bIsLog0TraceStopTriggerDetected and sys_bIsLog0DataRecordingDone turn to TRUE.
The time chart cannot be activated while the data recording function is being executed.
The Buffer free space system data register of the LOG that has been set to Trace is always zero.
Restrictions on time chart monitor
The restrictions on the time chart are as follows.
Although a maximum of 16 trace configurations can be executed in the PLC (if all LOGs are run for the trace application), only one LOG can be displayed in the Trace time line chart.
A maximum of 500 variables can be registered for one LOG, however, there are restrictions on variables to be graphically displayed on the time chart.
In case of inputs/outputs (bit registers): According to the resolution of a display
In case of data registers: Up to six registers
Time cannot be measured with the cursors (C, R) on graphs when the LOG displayed as a time chart is the data that was traced with logging triggers other than constant period.

