The FP Data Analyzer is a software tool for acquiring and analyzing recorded data on multiple channels connected to any Panasonic PLC. FP Data Analyzer uses the Panasonic MEWNET Manager. This section describes how to set up the FP Data Analyzer with a typical sample program.
Connect the PLC to a free COM port, Ethernet or modem
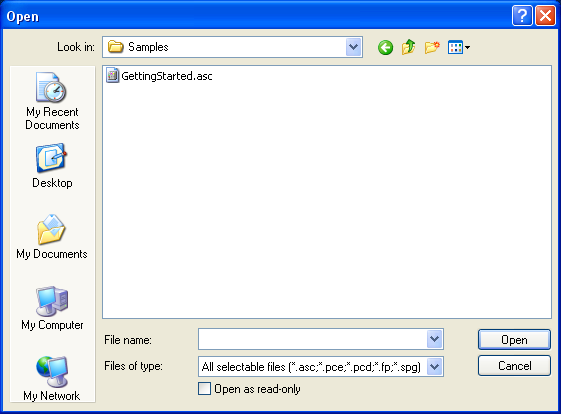
Start Control FPWIN Pro and create a new project from file “GettingStarted.asc” from the samples folder
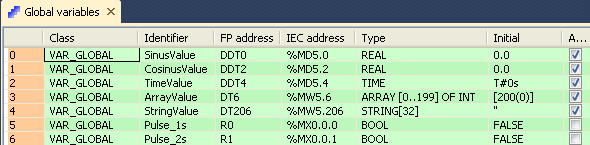
In the GVL, the following global variables are declared:
Compile and export the global variable list
Select Variables as CSV file®Global variables...
Deactivate the two options "Export column title as first line" and "Export array elements as a single variables"
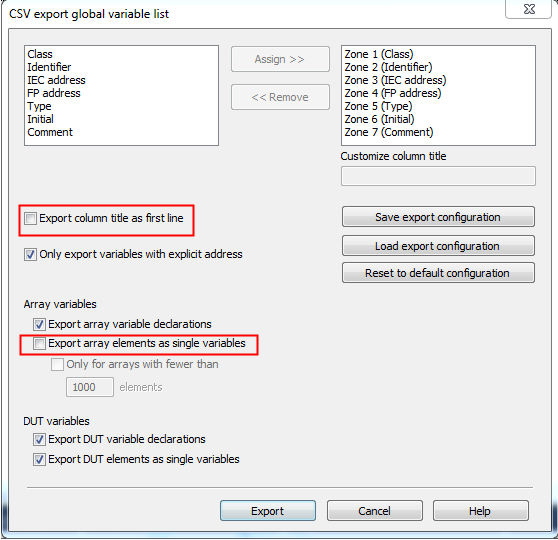
Select [Export]
Select the file type "CSV files (Multibyte) (*.csv)" to save the CSV file in Multibyte format. This format is required to display the variable list in the FP Data Analyzer correctly.
Download the program to the PLC
Start FP Data Analyzer via Start®Programs®Panasonic-ID SUNX Control ® FP Data Analyzer 1
The Analyzer starts with an empty window. Before you can start acquiring and analyzing data, you must insert one or more channels to visualize the data of the PLC variables.
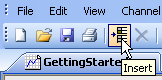
Insert a channel
The following window opens:
If this window does not appear, please execute the following command at the DOS prompt:
Regsvr32 "C<Your installation directory>\GvLControl.ocx"
Use [Open] to open the csv file you exported from FPWIN Pro in step 3
Select the entries that you want to watch
Select multiple entries using <Ctrl> and/or <Shift>.
Insert PLC variables to record with [Insert] or double-click a single line to insert
The variables are now inserted. Please close this dialog now.
Start recording
Check the communication parameters with Record®Communication Parameters. The PLC has to be in RUN mode. If necessary, change the PLC mode.
Stop recording
Evaluate and analyze recorded samples in a graphical, textual or XY-mode views during or after recording
Except for zoom window, all other zooming functions can be used during real-time recording. Some analysis functions require you to either stop recording or switch to background recording.
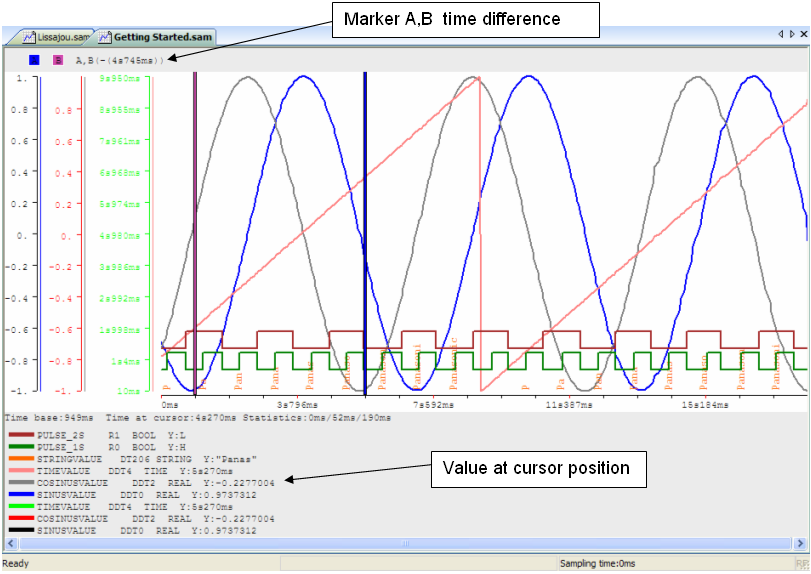
Time measurement using markers.
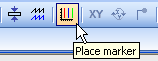
Click on the "Place marker" icon to place up to 4 markers inside the current client. Click on the marker either in the marker area or trace area and drag it to the location you want.
The marker's position in the marker area is shown either as absolute time or delta time between all other markers. Double-clicking one of the markers or trigger icon moves this marker inside the client.
Moreover, you can choose from the following options:
Print samples for documentation
Set up view properties
Set up channel properties
Set trigger combinations to start and/or stop recording